If you’ve been in real estate long enough, today’s market feels familiar—but also strangely different. That’s because while pieces of this cycle echo the past, the full picture is something we haven’t quite experienced in this exact form.
The closest comparison is a blend of two very different eras: the inflation-driven housing surge of the 1970s and the credit-fueled boom of the mid-2000s. The key difference? Today’s market is defined less by risky lending and more by an ongoing affordability squeeze.
The Long View: Real Estate Moves in Cycles
Historically, U.S. housing follows long-term boom-and-bust patterns. Some analysts point to roughly 18-year cycles, with major peaks around 1837, 1873, 1893, 1929, 1974, and the early 2000s.
While no two cycles are identical, they often rhyme—giving us useful context for understanding where we might be today.
The Mid-2000s Parallel: A Familiar Boom
The most obvious comparison is the 2005–2007 housing peak. From the late 1990s through 2006, home prices surged at an unsustainable pace. According to historical data from the European Central Bank, that period reached an unusually “hot” state, peaking around 2005–2006.
The pattern was clear:
Rapid price acceleration
Loosening credit standards
Increased speculation
Rising delinquencies
A sharp market correction that fed into the financial crisis
It was a classic boom-to-bust cycle—driven largely by excess leverage.
The 1970s Echo: Affordability Under Pressure
A more subtle, but arguably more relevant comparison is the 1970s. During that decade, inflation pushed real estate prices higher, but rising interest rates eventually made homes less affordable and slowed demand.
Sound familiar?
Today’s buyers are facing a similar challenge: even if prices stabilize, higher borrowing costs are keeping monthly payments elevated. Just like in the 1970s, affordability—not speculation—is the main constraint.
What Makes Today Different
Here’s where the current market breaks from the past.
This is not 2008. The underlying issue is not widespread subprime lending or systemic credit instability. Instead, we’re seeing a market shaped by three dominant forces:
Persistently high home prices
Elevated mortgage rates
Tight housing supply
The result is a kind of stalemate:
Buyers are constrained by affordability
Sellers are locked in by low-rate mortgages
Inventory remains limited
Transaction volume slows, but prices don’t collapse
In other words, this is less of a bubble and more of a pressure cooker.
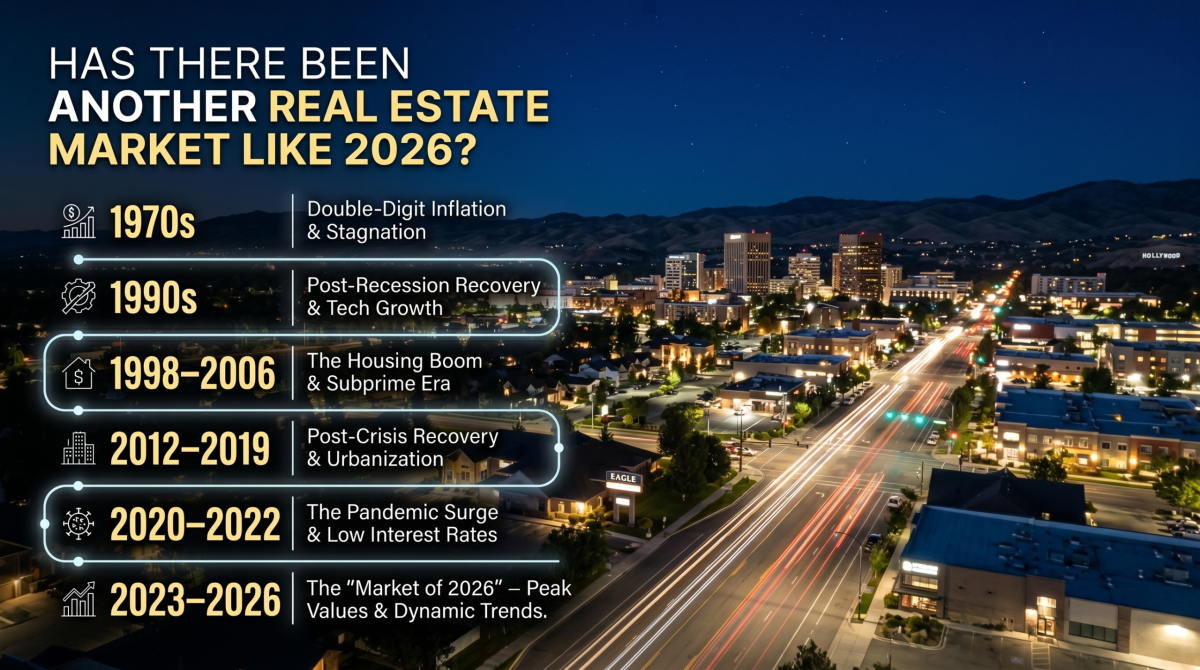
A Quick Timeline for Context
1970s: Inflation-driven growth followed by an affordability crunch
1990s: Steady, moderate expansion
1998–2006: Rapid appreciation leading to the 2008 crash
2012–2019: Recovery and normalization
2020–2022: Pandemic-driven demand surge
2023–2026: High rates, low inventory, and affordability strain
The Bottom Line
So, have we seen this market before?
Yes, but only in fragments.
Today’s housing landscape most closely resembles a hybrid: the affordability challenges of the 1970s combined with the price momentum of the early 2000s. What it does not reflect is the fragile credit environment that led to the 2008 collapse.
Want more help. Let us share our extensive experience with you.
RE# SP57698 | AB 57988
Silvercreek Realty Group
(208) 406-8424
chucklamb@chucklamb.com
renee.lambre@gmail.com
https://eagleidahohomesales.com/
https://realestateinstaridaho.com/
https://CheckLamb.com
https://linktr.ee/reneelamb

Leave a Reply